
race-recap
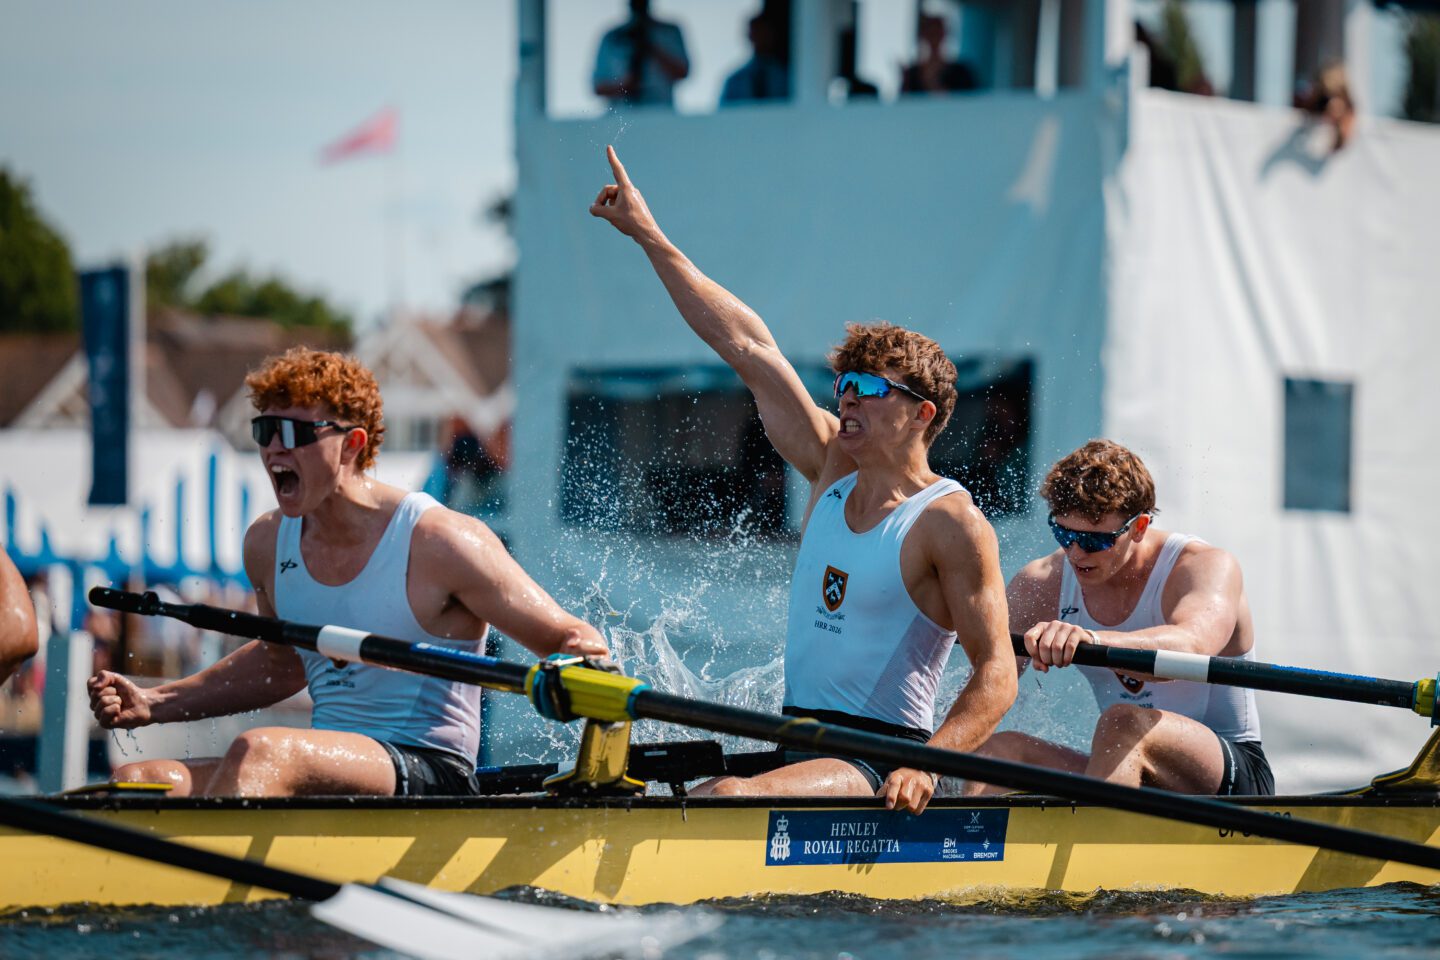
Henley 2026, Day 6: St. Paul's takes the Princess Elizabeth — and ends the season as the model's number one
St. Paul's won the Princess Elizabeth Challenge Cup on Sunday afternoon, beating St. Edward's by two-thirds of a length in 6:20. Five races, five wins, never headed. They finish the season as the…
Aug 11, 2026·Read full analysis →
race-recap
Henley 2026, Day 4: St. Edward's beats the model again, and the semi-final the draw promised is set

race-recap
Henley 2026, Day 5: St. Paul's edges Radley, St. Edward's beats the model a third time, and the Final is set

race-recap
Henley 2026, Day 2: Kings College sends the last American home, and Radley and St. Paul's pull clear
race-recap
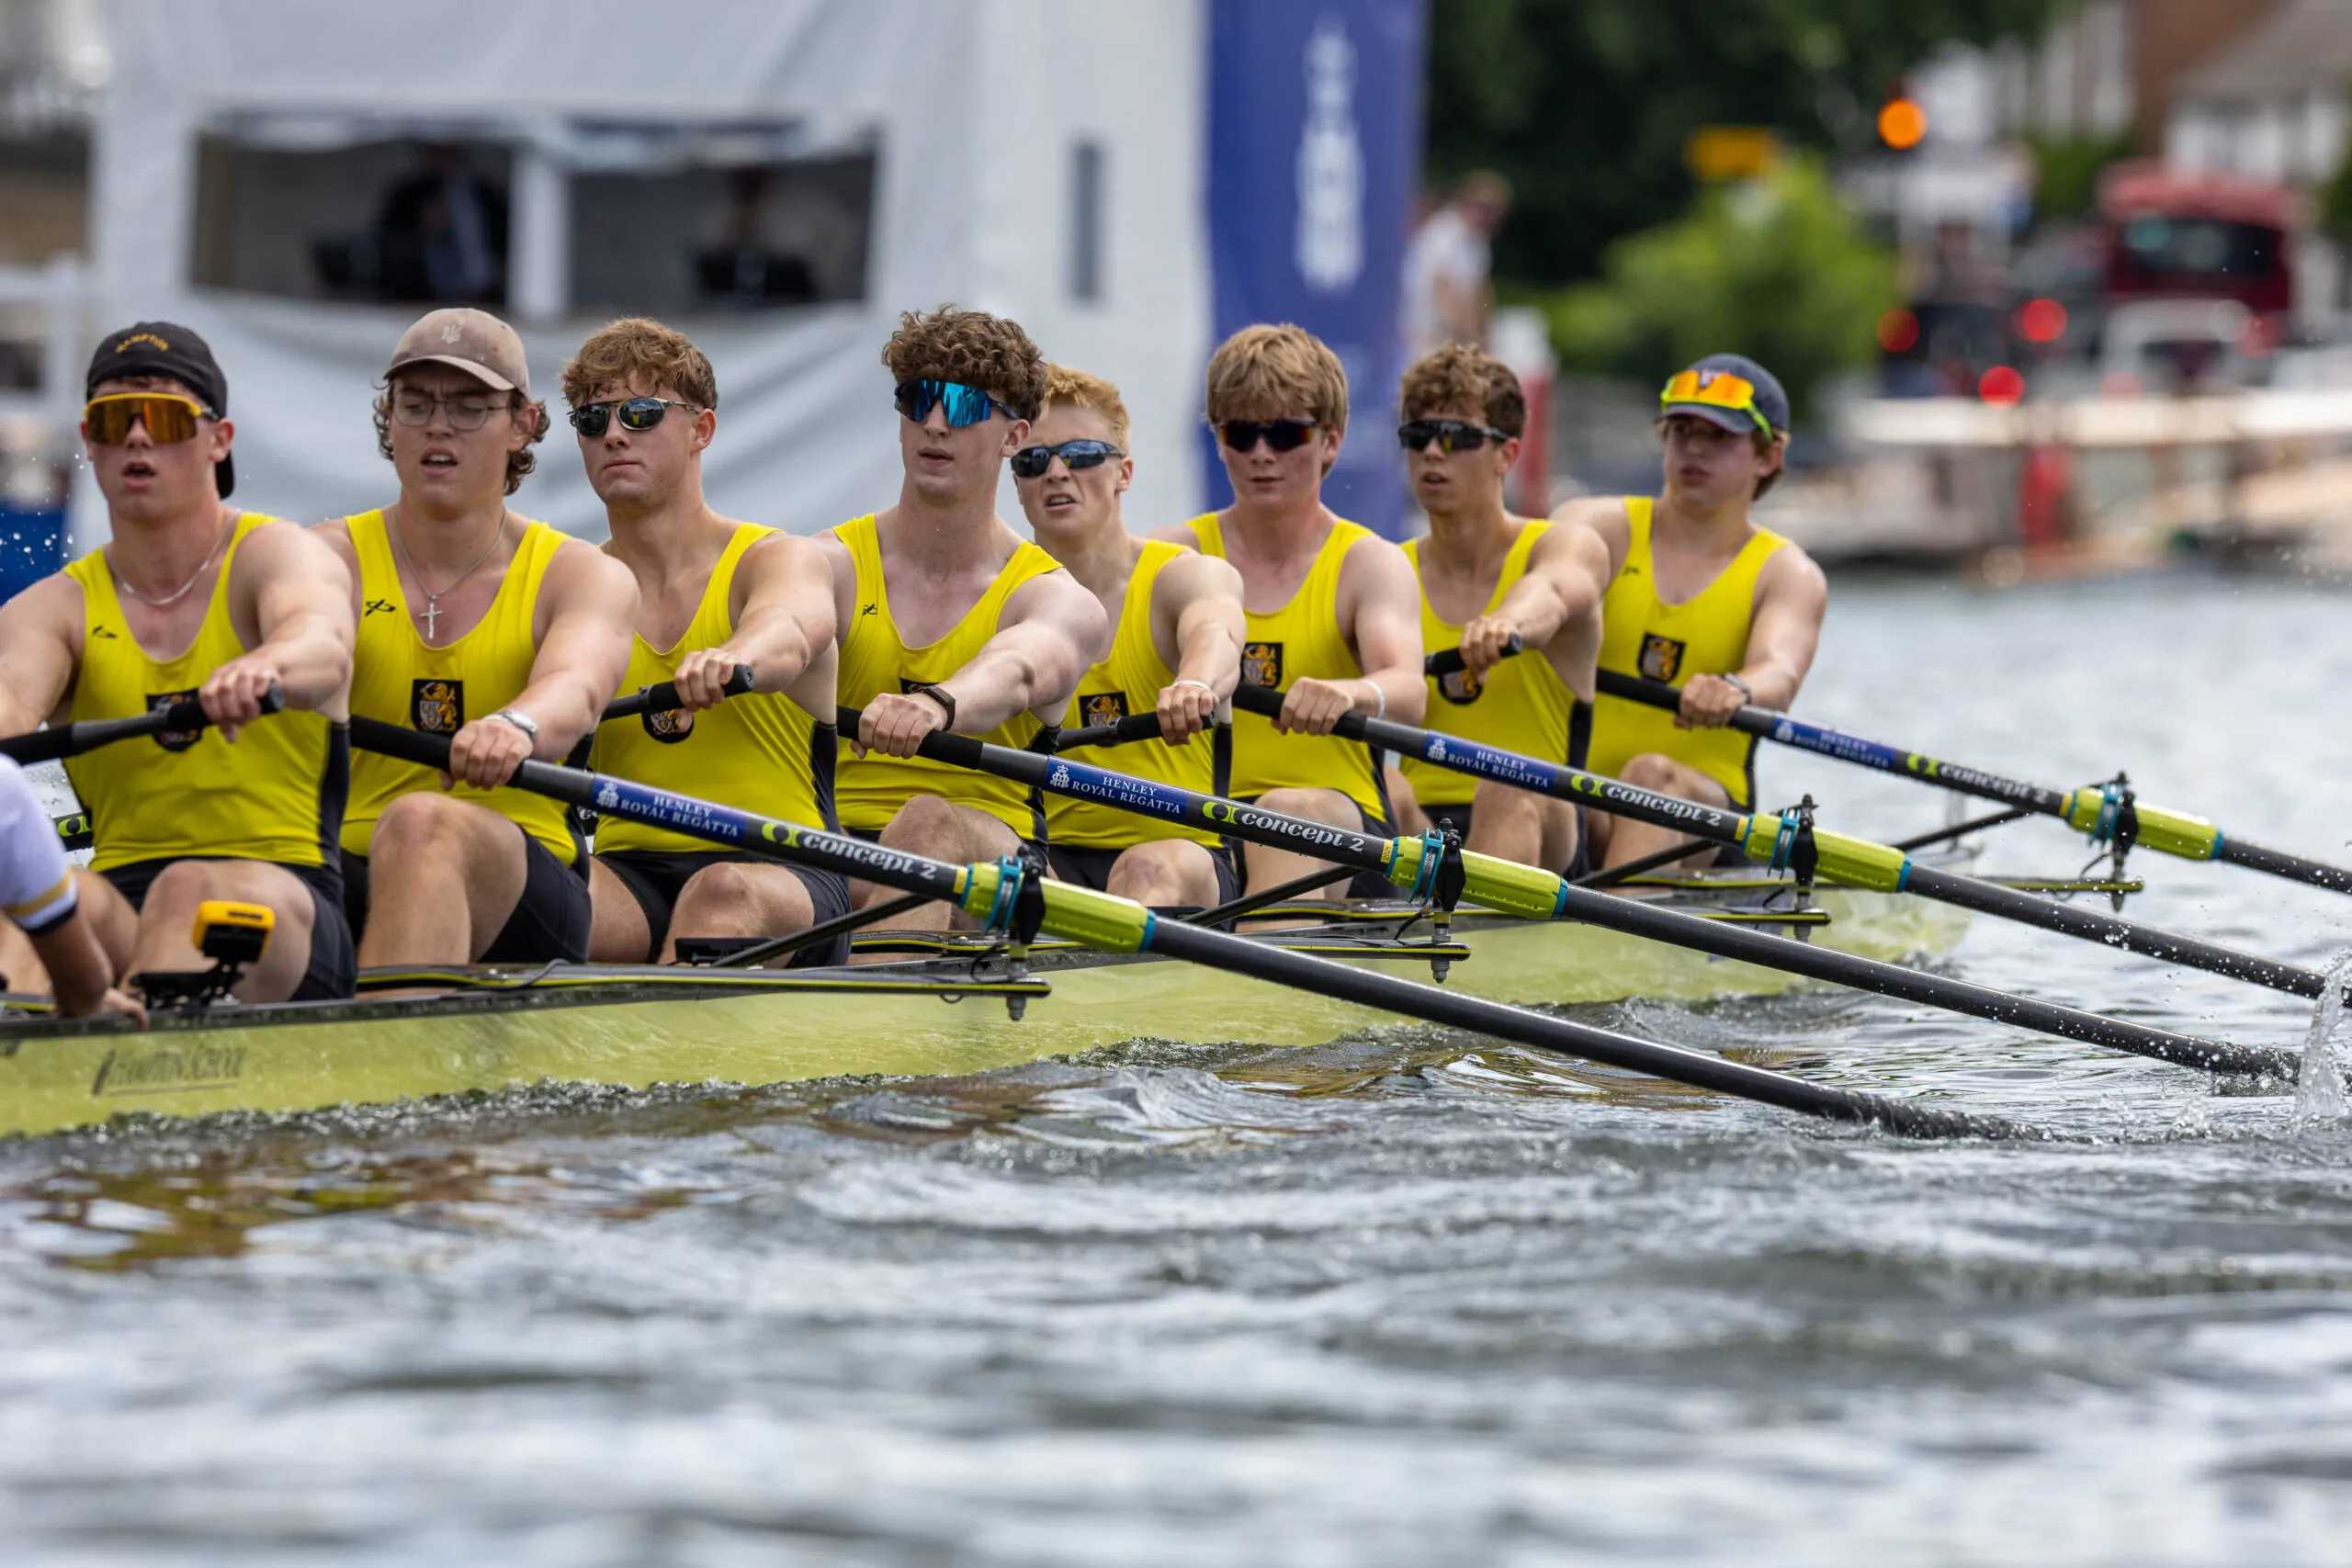
Henley 2026, Day 1: The favourites hold the Princess Elizabeth, and Deerfield is the last American standing
rankings
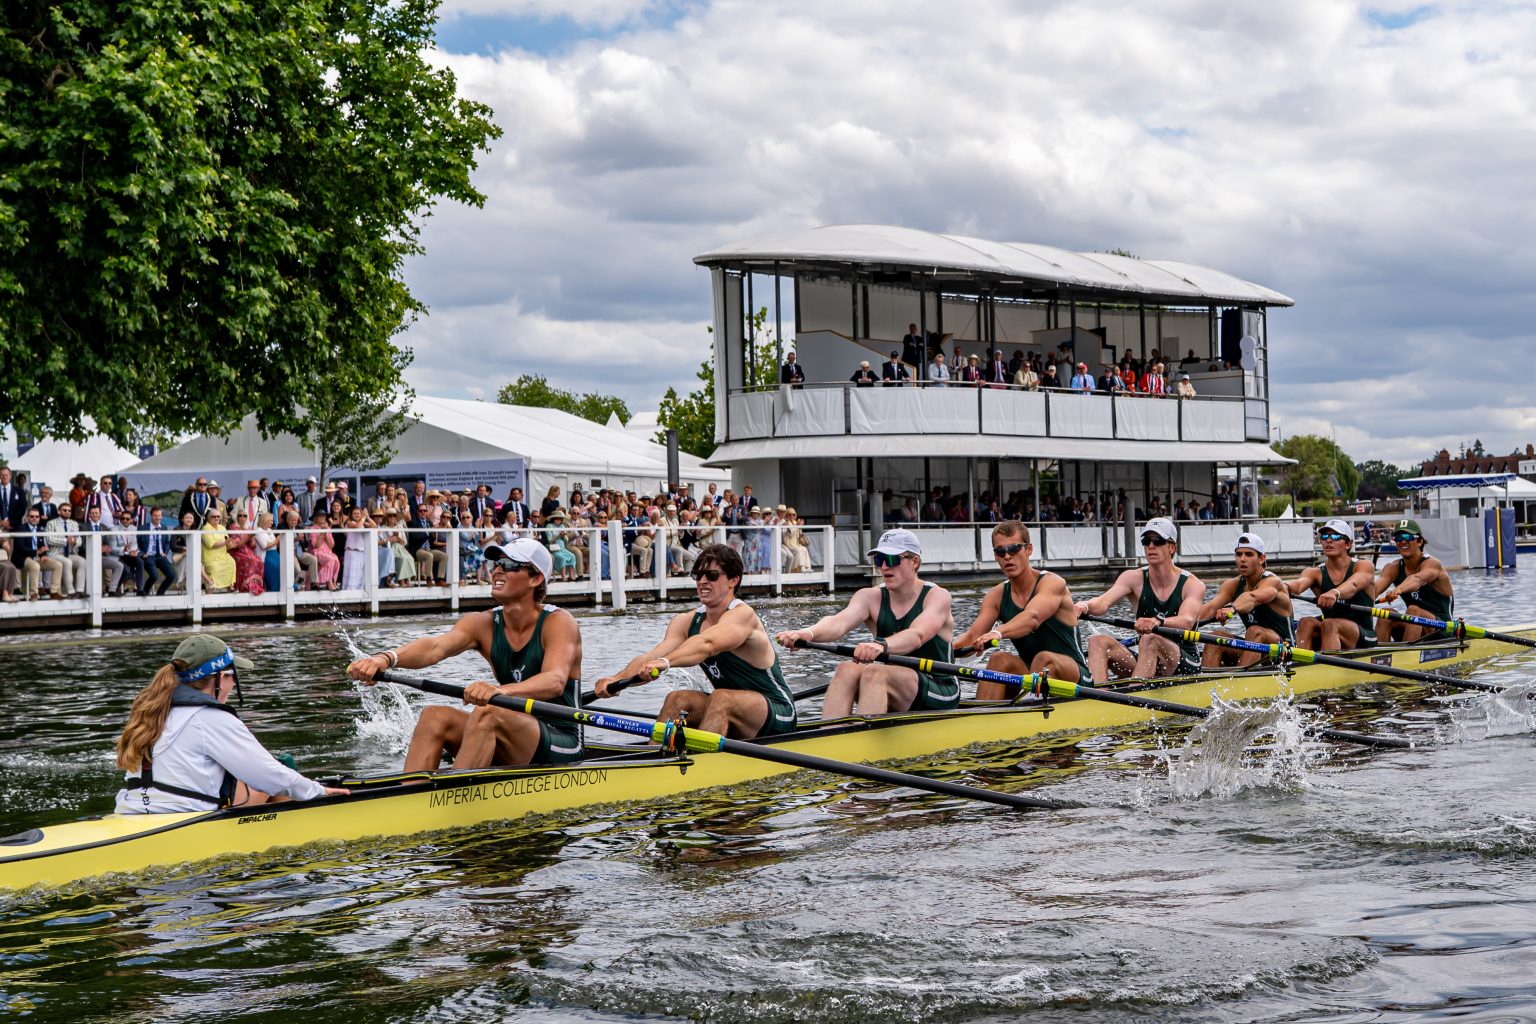
The British rankings, and a preview of National Schools'
Recent ResultsAll regattas →
W 2V8+Oct 25
Head of the Schuylkill
| 1 | 13:16.858 | |
| 2 | 13:34.460 | |
| 3 | 13:41.445 | |
| 4 | 13:46.743 | |
| 5 | 13:50.276 |
M 2V8+Oct 25
Head of the Schuylkill
| 1 | 11:57.174 | |
| 2 | 11:57.868 | |
| 3 | 11:57.934 | |
| 4 | 12:02.978 | |
| 5 | 12:08.706 |
W V8+Oct 25
Head of the Schuylkill
| 1 | 12:52.411 | |
| 2 | 12:57.877 | |
| 3 | 13:04.199 | |
| 4 | 13:15.440 | |
| 5 | 13:20.221 |
M V8+Oct 25
Head of the Schuylkill
| 1 | 11:05.732 | |
| 2 | 11:09.415 | |
| 3 | 11:19.483 | |
| 4 | 11:22.170 | |
| 5 | 11:30.659 |
W 2V8+Oct 18
60th Head of the Charles
| 1 | 17:34.339 | |
| 2 | 17:43.087 | |
| 3 | 17:54.209 | |
| 4 | 18:01.004 | |
| 5 | 18:06.915 |
M 2V8+Oct 18
60th Head of the Charles
| 1 | 15:37.855 | |
| 2 | 16:22.064 | |
| 3 | 16:26.507 | |
| 4 | 16:27.115 | |
| 5 | 16:32.754 |
W V8+Oct 18
60th Head of the Charles
| 1 | 16:38.162 | |
| 2 | 16:46.537 | |
| 3 | 16:56.960 | |
| 4 | 16:59.481 | |
| 5 | 17:00.791 |
M V8+Oct 18
60th Head of the Charles
| 1 | 14:11.288 | |
| 2 | 14:20.688 | |
| 3 | 14:32.777 | |
| 4 | 14:36.088 | |
| 5 | 14:44.219 |
How RPI Works
Each rating comes with a range showing how sure the model is. Every race updates all of them.
The Algorithm
1
Each rating is a best guess with a range
Each crew has a most-likely speed and a 90% credible interval around it. Crews that race often have narrow ranges. New crews start wide.
Greenwich 2069 · 90% CI 2020–2118
2
Win chances come from comparing two crews
We compare the two crews' full posterior distributions. Curves far apart mean a confident pick. Overlapping curves mean a coin flip.
Greenwich 2069 vs Row America Rye 2034
Predicted: 80% chance for Greenwich
Margin: -5.3 to +16.1 sec (90% interval at 3800m)
Posterior comparison
3
Every race updates every rating
The model rates all crews together (hierarchical pooling), so one result moves more than the two crews in it. Beating a crew from a strong league counts for more, and league strength is learned from the races too.
One race result → every team's posterior shifts
League strengths update with team ratings
No K-factor: the data sets how far a rating moves
Accuracy & Calibration
74%
Calls correct
13,000+
H2H pairs tested
PredictedActual win rate
50–55%56%
55–60%60%
60–65%67%
65–70%71%
70–80%79%
80–90%87%
90–100%94%
When the model says X%, the favorite wins about X% of the time.
Each race is scored with the ratings from before it was rowed.
Each race is scored with the ratings from before it was rowed.